

 Jun 14, 2025
 4 min read
Understanding Classification and Regression: Fun Examples for Kids!
When people say a computer has "learned" something, they usually mean it has been shown lots of examples with the right answers attached, and has worked out a rule that gives the right answer for new examples it has never seen. This is called supervised learning. Most of it comes in two kinds, and the difference between them is simple: is the answer a group, or a number?

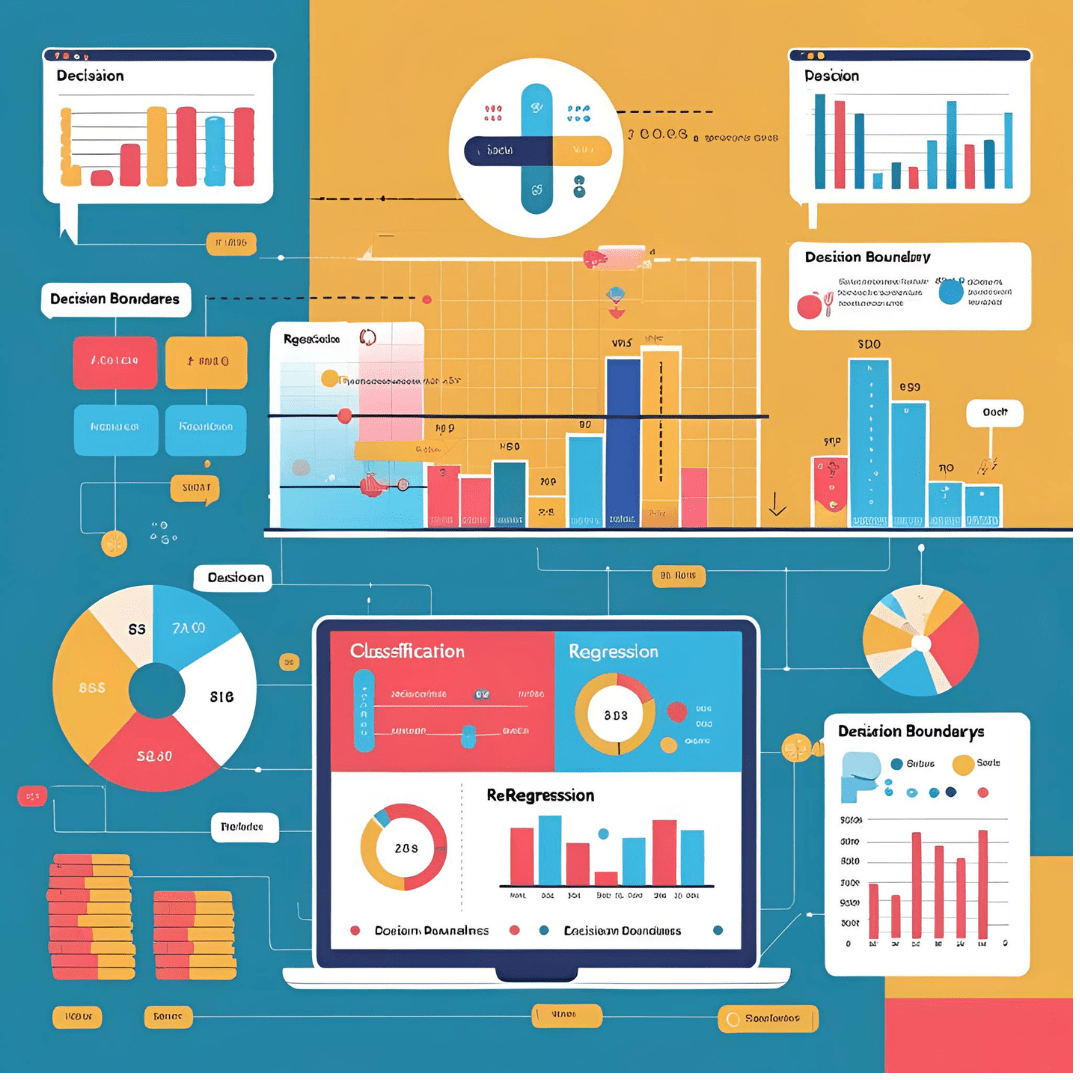
Illustration: classification means sorting things into groups.
Classification: which group?
In classification the answer is a label. Is this email spam or not? Is the animal in this photo a cat or a dog? Is this fruit an apple or a banana?
Here is how a computer could learn the fruit one. Suppose you weigh and measure fifty apples and fifty bananas and write down, for each one, its weight, its length and which fruit it is. Bananas tend to be long and thin; apples are short and round. If you drew every fruit as a dot on a chart, with length along the bottom and width up the side, the bananas would gather in one corner and the apples in another. A classification program finds a line between the two groups. When a new fruit arrives, it checks which side of the line the new dot lands on and gives that label.
One of the most famous practice examples in the subject works exactly like this. In 1936 the statistician Ronald Fisher took measurements of 150 iris flowers from three species, collected by the botanist Edgar Anderson: the length and width of their petals and of the sepals, the leaf-like parts under the petals. He showed how to use the measurements to tell the species apart. Nearly ninety years later, students learning machine learning still start with Fisher's iris flowers.
Regression: how much?
In regression the answer is a number. How many minutes until the pizza arrives? What will the temperature be tomorrow? How tall will this tomato plant be next week?
Take the pizza. A pizza shop could write down, for every delivery, how far away the house was and how long the delivery took. Plot those as dots, with distance along the bottom and minutes up the side, and the dots will roughly follow a sloping line: further away, longer wait. A regression program finds the line that fits the dots best. Suppose it works out that a delivery takes about 10 minutes plus 4 minutes for every kilometre. Then for a house 5 kilometres away it predicts 10 + 4 × 5 = 30 minutes. It won't be exactly right every time, because of traffic and how busy the kitchen is, but it will usually be close.
The odd name comes from the Victorian scientist Francis Galton. In 1886 he compared the heights of parents with the heights of their grown-up children. Very tall parents tended to have children who were tall, but a bit less tall than them; very short parents had children a bit less short. The children's heights "regressed", or moved back, towards the average. The mathematics Galton used to describe this is the same straight-line fitting used in the pizza example, and the name stuck.
Try it yourself
You can play both games without a computer. For classification, gather a pile of mixed objects, such as leaves, coins or Lego bricks, and decide on a rule for sorting them by measuring something: length, weight, number of points. Then ask someone to hand you a new object and see if your rule puts it in the right group. For regression, guess how many steps it takes to walk from your bedroom to the kitchen, from the front door to the gate, and from the kitchen to the bathroom. Count each one, write the answers next to the distances, and see whether you can find a rule that predicts the number of steps for a walk you haven't counted yet.
That is all a machine-learning program does, with far more examples and much faster arithmetic. The hard part, for people and computers alike, is choosing good examples to learn from. If every banana you measured happened to be very small, your rule might start calling big bananas apples.
Sources
- scikit-learn documentation, "Supervised learning". https://scikit-learn.org/stable/supervised_learning.html
- Google for Developers, Machine Learning Crash Course, "Linear regression". https://developers.google.com/machine-learning/crash-course/linear-regression
- R. A. Fisher, "The use of multiple measurements in taxonomic problems", Annals of Eugenics 7 (1936): 179–188. https://doi.org/10.1111/j.1469-1809.1936.tb02137.x
- UCI Machine Learning Repository, "Iris" data set. https://archive.ics.uci.edu/dataset/53/iris
- Francis Galton, "Regression towards mediocrity in hereditary stature", Journal of the Anthropological Institute of Great Britain and Ireland 15 (1886): 246–263. https://doi.org/10.2307/2841583





Comments (0)
Leave a Reply
Comments are moderated. Please read our Comment Policy before posting.
Log in to post a comment.